assignment 2 & 3 Big Data Analysis Implementation in Daily Activities
Big data Analysis implementation in daily activities,
Using a Samsung's Health Tracker app to monitor my daily step's between June and July 2017 and compare it between the other app user .
it was all started when the app give constant notification about how much the time and distance I've covered when i was walking even on short period of time. and the app also provide me with a monthly report, this report also tells me about the total time, distance & steps that i gain in that month. and i was curious about this report and wanted to analyze more about the information since it is one of big data analysis implementation in daily activities so i picked up two months where at that month is where i spent my summer break on,
JUNE
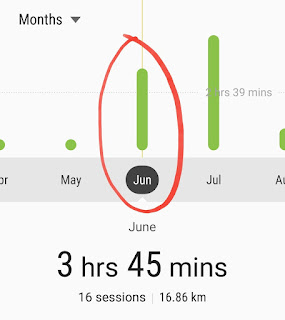
at this month it was the beginning of a holiday where i spent a lot of my time outside of my house to do certain activities. as it could be seen on the picture above i spent almost 4 hours on June in total and about 16.86 km in the distance, its a great result in my opinion, because as we could see from the picture my monthly average time of walking was only 2hrs and 39mins so compared to this month it is way above average and the number of steps is way better than the previousa months.
JULY
July is where most of the walking happened it took 5hrs and 16mins in total of time and covered 23.21km in distance it is the biggest achievement in 2017 for me. but it doesn't end there because i start questioning about how does people my age performed am i below or above the average.
COMPARISON TO OTHERS
significantly my rank increased from 58% to 49% that also means that there is a variety of age that are in this leaderboard from a kid to an elderly could be at this leaderboard even though my rank is higher but it is still below the average an this is the end of the comparison what i got from this simple experiment is even with an unimportant unit such as steps we could get a lot of information such as how much we spent and how much we've covered and how do our performance compared to another, an useless/unnimpotant thing could be important if we see it in many ways and it is all depends on how we managed to use it and how we are able to stand for the complexity of it.


Komentar
Posting Komentar